


⏩The largest food distributor in Italy: Marr SpA
Stocks that pay a dividend while you wait for capital appreciation

Paid to Wait works as a starting point for investment research: presenting potential opportunities and helping readers to do further research on stocks that fit into their own (dividend investment) strategy.
In the newest edition we primarily cover Italian food service distributor Marr and secondarily lesser known American consumer goods company Reynolds.
A | Marr. Dividend yield 6.2%.
B | Reynolds Consumer Products. Dividend yield 4%.
A | Marr ($MARR)
🔑 Market leader in Italy, “family-owned”, active consolidator, consistent growth, earnings power likely to grow in medium term.
📉 Low-margin business, cost pressures appear sticky, limited orgranic growth.
Listing: Milan, Ticker MARR.
Marr in a nutshell: Marr is the largest foodservice distributor in Italy. It distributes groceries (50%), seafood (30%), meat (16%) and fruits and vegetables (4%) to restaurants, canteens and other wholesalers. Marr carries 25 000 products going through 40 distribution centers to over 55 000 customers. 65% of the sales go to so called street market segment, which refers to independent restaurants and hotels.
Founded: 1972
Investment thesis in brief: One could see Marr as a mean reversion play. While Marr’s revenue has grown significantly, its net income is still 30-40% lower than pre-covid years.
Marr has a significant investment plan in place. Its purpose is to mitigate increased costs, expand capacity and enable organic growth. The first part of the Phase 1 was already completed a year ago and following parts are completed 2025-2026.
The stock price trades at a lowest level since 2012 and October 2022 bottom. An investor can purchase the stock at a reasonable valuation by depressed earnings.
Due to the timing of the investment plan, continued cost pressures and potential consumer weakness, Marr is likely a case that takes couple of years to bear fruit. Meanwhile an investor collects a handsome dividend. Long-term growth is realized through modest industry and organic growth and bolt-on acquisitions.

Share price / Market cap: €9.7 / 650 million euros.
Closest peers: for example Sysco SYY 0.00%↑ and Kitwave.
Bull case 🐂
Market leader: Marr claims to be the only player with a nation-wide footprint. Among wholesalers it has a market share of 17% in terms of revenue and 26% in terms of number of customers.
90% of the Italian restaurant and hotel operators are independent.
Family-owned: 50.4% of the shares are owned by a company called Cremonini, which is a home of a group of companies operating in the food and restaurant industry. Cremonini is owned by Cremonini family.
Growth record: In the past two decades Marr has grown revenues at a CAGR of 4.4%. There are over 200 000 potential customers which gives Marr an opportunity for continued organic growth.
Investments plan: Marr is building new distribution centers in three different locations. One of them is completed. In the future it intends to strengthen its platform around Milan region with a large 40k squaremeter facility.
Active consolidator: The latest acquisitions Marr made in 2021 and 2022 (€67-70 million of revenue). The acquisitions were valued at EV/S-multiple 0.2-0.3x.
Due to the investment plan it appears unlikely that Marr would make acquisitions in the near future.

Market expectations: Revenue has recovered significantly above (€400 million) pre-covid level (partly as a result of two acquisitions). However, the market might be extrapolating the lower profitability level to continue into perpetuity.
It is difficult to come up with a reasoning why the profitability of food distribution would be permanently impaired.
Marr refers to “structural increase of transport and handling of goods”. One could assume that due to the fragmented and competitive nature of food service distribution it likely takes time to carry cost increases forward to the customers.
On the other hand, one could speculate that due to the increased revenue/volume Marr’s infrastructure could be lagging behind and investments are required to match the demand.

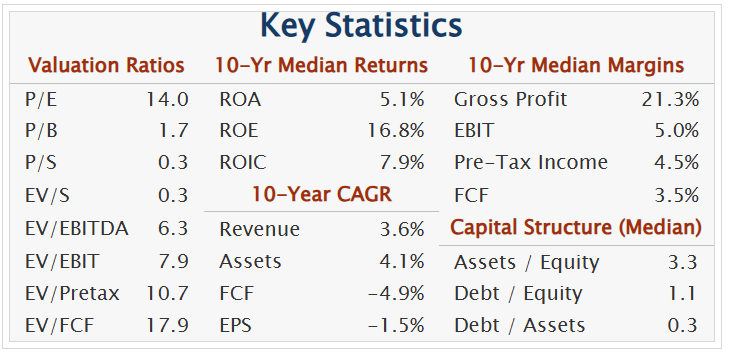
Valuation💰
Revenue: Marr has typically traded at an EV/S-multiple of 0.8x. Currently EV/S stands at 0.4x. This is naturally due to the triple effect of increased revenue, declined net income and multiple compression.
Earnings: Marr’s 10-year average EPS is €0.7. In the years preceding the pandeminc, 2016-2019, Marr’s EPS was hovering between €0.9-1.
According to Koyfin Marr’s 10-year average forward P/E is approximately 20x and forward EV/EBIT 15x. Currently these multiples stand at 13.5x and 10x.
Simply a reversal to an EPS of €0.9, and applying a 15x multiple on it, would mean a stock price of €13.5, an upside of 30-40%.
The focus on recovering operating profitability has also been confirmed, through the management of the gross margin and euro/kg ratio of the products sold and keeping operating costs under control.
-Francesco Ospitali, CEO (Source)
“The objective remains that of re-approaching a profitability level (EBITDA in absolute value) seen pre-Covid and will also depend on the rollout of the overall investment plan.”
Cashflow: According to Koyfin Marr is now trading at a P/FCF-multiple of 10.5x.
Peers: American food distributors, Sysco, US Foods and Performance Food Group, trade at a P/E-multiple of 16-18. A smaller British distributor Kitwave is valued at 13x.
German Metro Ag was recently taken over by its largest shareholder at a great premium, implying a multiple of approximately 18x.
In the light of peers a multiple of 15x for Marr appears justified.
Balance sheet: In 2024 Marr’s net debt to EBITDA ratio was 1.6x. Despite the investment plan, the company expects the ratio to remain below the target of 2x.
Dividend: This year Marr is about to pay a dividend of €0.6 two years in a row. The payout ratio stands at 90%. Dividend yield 6.2%. Ex-dividend date is 19th of May.
Target price: Marr is followed by five analysts with an average target price of 13 euros.
Bear case 🐻
Consumer sentiment: Marr will do well if restaurants do well. Lower consumer confidence and purchasing power could meant that consumers will eat more at home. In 2024 there was no big variation compared to the year before:
"Hotels, meals and out-of-home consumption" segment in Italy in 2024 increased by 1.2% compared to 2023, while according to TradeLab (AFH Consumer Tracking, February 2025), the number of visits to "Away From Home" (AFH) structures in 2024 decreased by 1.6% compared with 2023. (Source: Marr’s conference call 14th of March)
Margin profile: Distribution and food distribution especially is inherently low margin and high volume business. Although Marr has historically stable gross margins, the value is created or destroyed on the lower levels of the income statement.
While Marr’s operating margin was 6-7% before the covid-panic, the company has struggled to return to the historical level for the past four years (operating margin of ~4%).
It is unclear why exactly Marr has not been able to pass on the increased costs to its customers. The reasons might include desire to hold on to market share, inability to respond to wage and transportation cost increases rapidly enough (long-term customer contracts with chains) and rise of other costs such as energy and financial expenses have made a further dent to the profitability.
Ambition: Marr aims to return to the pre-pandemic level of EBITDA in absolute terms. The goal is quite modest considering the revenue growth and two acquisitions that the company made in 2021 and 2022.
Summary
Most likely it will take approximately two years for Marr to reap all the benefits from its investments. It might happen that Marr’s earnings are not right yet set for a jump. However, the management appears to be on top of the issue. Meanwhile an investor can take a benefit of the dividend. Marr’s shares appear attractively valued, especially if the company is able to return to its previous level of profitability.
Read more: Intermonte bank’s commentary on full year results.
My twitter handles
🇬🇧 English: @paidwait
🇫🇮 Finnish: @anttisleinonen
B | Reynolds Consumer Products
I published an analysis on lesser known Reynolds Consumer Products on Seeking Alpha. Here’s a Copilot generated but adapted summary, and a link to the full analysis.
Bull case
Strong market position: Reynolds’ brands are in 95% of American households, ensuring widespread demand and reinforcing its ability to maintain stable sales.
Product innovation driving sales: 20% of revenue comes from newly launched products.
Debt reduction enhances growth prospects: The company has repaid $560 million in long-term debt over four years, lowering interest expenses and improving financial flexibility for expansion, product development, and potential dividend increases.
Resilient demand in market turbulence: Reynolds produces essential household goods, making it a defensive stock. Even as the economy fluctuates, its ability to defend margins and maintain steady earnings attracts long-term investors.
Valuation
Historically low multiples offer upside: Reynolds trades at a forward p/e of 14, significantly below its five-year average of 18, suggesting potential undervaluation.
Profitability and returns on capital remain strong: Despite slight revenue declines, Reynolds’ earnings per share have improved, and its operational efficiency supports better-than-average historical profitability.
Fair value estimate suggests buying opportunity: Based on historical earnings growth and an 8% discount rate, shares appear fairly priced between $21-22.
Comparison to larger consumer goods companies: While peers such as Unilever, Clorox, and Procter & Gamble trade at higher multiples (19-26), Reynolds maintains stable earnings growth, lower leverage, and a solid market position, potentially justifying an upward valuation adjustment.
Bear case
Revenue decline expected in 2025: The Hefty tableware unit continues to struggle, with declining sales and weakened margins. Reynolds anticipates a low single-digit revenue drop, falling short of analysts’ expectations and potentially pressuring share price performance.
Exposure to rising costs and raw materials: While U.S.-based production protects Reynolds from tariffs, it remains vulnerable to inflation, particularly in raw material costs, which could squeeze profitability if input prices remain volatile.
Limited pricing power with major retailers: Large retail distributors exert strong control over pricing negotiations, limiting Reynolds’ ability to fully pass cost increases to consumers. While its branded and private-label offerings provide some leverage, profitability growth remains constrained.
High goodwill and intangible assets pose a risk: A substantial portion (60%) of Reynolds’ assets consists of goodwill and intangibles, increasing the risk of impairment if consumer purchasing power weakens or the broader economic environment deteriorates.